
Seminar on Research Reports
Submitted By:
Afra Maria Lobo
Anoop Kumar
Anupama Rao
Arrel Vijay Moras
Ashoka
Avinash B
Chandni
Crysel Crasta
Sharlet D’mello
Table of Contents
| Sl No | Topic |
| 1 | Introduction |
| 2 | Characteristics of research report |
| 3 | Types of report |
| 4 | Oral report |
| 5 | Written report |
| 6 | Preparation of research report |
| 7 | Precautions of report writing |
| 8 | Graphical representation of report |
| 9 | Bibliography |
Introduction:
A report is a very formal document that is written for a variety of purposes, generally in the sciences, social sciences, engineering and business disciplines. Generally, findings pertaining to a given or specific task are written up into a report. Reports are considered to be legal documents and thus need to be precise, accurate, and difficult to misinterpret.
There are 3 features that together characterize report writing at a very basic level
Ø Pre-defined structure
Ø Independent sections
Ø Unbiased conclusions
Characteristics of research report:
Characteristics feature is an integral part of the report. The research report will differ based on the need of the particular managers using the report. The research also depends on the philosophy of the researcher. e.g. A report prepared for a government agency will be different from the one prepared for a private organization. There are certain characteristics which a report should possess if it is to be effectively communicated.
They can be classified as:
1. Substantive characteristics
2. Semantic characteristics
SEMANTIC CHARACTERISTICS:
Semantic characteristics are equally important in report. The report should be grammatically correct. It should be free from spelling and typing errors. This will ensure that there is no ambiguity or misunderstanding. Assistance of a proof reader, other than the researcher would be required to eliminate the above errors.
Ø Creative expressions in the form of superlatives, similes should be avoided.
Ø The report should be concise.
Ø Jargon of any kind should be avoided.
Ø Common words with multiple meaning should be avoided.
Ø Language of the report must be simple.
Ø Avoid using ‘I’ ’we’. The report should be more impersonal.
Ø Sometimes, the current research uses the data of research conducted in the past. In this case it is better to use past tense than present tense.
Ø The following are the hindrances for clarity of any research report.
Ø Ambiguity
Ø Jargon
Ø Misspelled words
Ø Excessive prediction
Ø Improper punctuation
Ø Unfamiliar words
Ø Clerical errors
SUBSTANTIVE CHARACTERISTICS:
The more the report possesses these characteristics, the greater is its practical value in decision making.
Ø Accuracy
Ø Currency
Ø Sufficiency
Ø Availability
Ø Relevancy
Accuracy:
Accuracy refers to the degree to which information reflects reality. Specifically the research report must accurately present both research procedure and results.
Currency:
Refers to the time span between of the research project and presentation of research report to management .It is one of the reasons for orally or informally communicating preliminary
Research results to management to ensure timely decision making.
Sufficiency:
The research report must have sufficient details so that important and valid decisions can be made by the manager. Also it should be remembered that the sufficiency characteristic does not mean that all possible research project information must be incorporated in the resource report.
Availability:
The important characteristic is that it is available to the appropriate decision maker when they need it. It refers to the communication process between researcher and the decision maker. The decision is made by the management and it is the duty of the researcher to carry out this decision. Most reports carry confidential information. Therefore, it is necessary to restrict the report availability to individuals as well as outside of an organization to prevent competitor from having access to it.
Relevancy :
The research report should be confined to the decision issue reached. Sometimes the researcher might include information, which he thinks is interesting, but may not have relevance. This type of information should be excluded from the report.
Types of Report
There are two types of reports:
1) Oral report 2) Written report.
Oral Report
This type of reporting is required when the researchers are asked to make an oral presentation. Making an oral presentation is somewhat difficult compared to the written report. This is because the reporter has to interact directly with the audience. Any faltering during an oral presentation can leave a negative impression on the audience. This may also lower the self confidence of the presenter. In an oral presentation, communication plays a big role. A lot of planning and thinking is required to decide ‘What to say’, ‘How to say’, ‘how much to say’. Also the presenter may have to face a barrage of questions from the audience. A lot of preparation is required, the broad classification of an oral presentation. is as follows.
Nature of an oral presentation:
Opening: A brief statement can be made on the nature of discussion that will follow. The opening statement should explain the nature of the project, how it came about and what was attempted.
Finding/Conclusion: Each conclusion may be stated backed up by findings.
Recommendation: Each recommendation must have the support of conclusion. At the end of the presentation, question-answer session should follow from the audience.
Method of presentation: Visuals, if need to be exhibited can be made use of. The use of tabular form of statistical information would help the audience.
What type of presentation is a root question? Is it read from a manuscript or memorized or delivered ex-tempo. Memorization is not recommended since there could be a slip during presentation. Secondly, it produces a centric approach. Even reading from the manuscript is not recommended because it becomes monotonous, dull and lifeless. The best way to deliver in ex-tempo is to make main points notes so that the same can be expanded. Logical sequence should be followed.
Points to remember in oral presentation:
- Language used must be simple and understandable.
- Time management should be adhered.
- Use of charts, graph etc will enhance understanding by the audience.
- Vital data such as figures may be printed and circulated to the audience so that their ability to comprehend increases, since they can refer to it when the presentation is going on.
- The presenter should know his target audience well in advance to prepare tailor-made presentation.
- The presenter should know the purpose of report such as “Is it for making a decision”, “Is it for the sake of information” etc
Guidelines
![]()
![]()
![]()
![]()
![]()
![]()
![]()
![]()

WRITTEN REPORT
Following are the various written reports
A. Reports can be classified based on the time- interval such as:
1. Daily
2. Weekly
3. Monthly
4. Quarterly
5. Yearly
B. Types of reports:
1. Short report
2. Long report
3. Formal report
4. Informal report
5. Government report
SHORT REPORT: short reports are produced the problem is very defined and if the scope is limited. For example, monthly sales report. It will run into about five pages. It consist of report about the progress made with respect to a particular product in a clearly specified geographical locations.
LONG REPORT: this could be both a technical report as well as non-technical report. This will present the outcome of research in detail.
TECHNICAL REPORT : this will include the sources of data, research procedure, sample design tools used for gathering data, data analysis methods used, appendix, conclusion and detailed recommendation with respect to specific findings. If any journal, paper or periodically is referred, such references must be given for the benefit of reader.
NON-TECHNICAL REPORT: this report is meant for those who are not technically qualified. Example Chief of the finance department. He may be interested in financial implications only, such as margins, volume etc. He may not be interested in the methodology.
FINAL REPORT:
Example: the report prepared by the marketing manager to be submitted to the Vice President (marketing) on quarterly performance, reports on test marketing.
INFORMAL REPORT: the report prepared by the supervisor by way of filling the shift log book, to be used by his colleagues.
GOVERNMENT REPORT: this may be prepared by state governments or the central government on a given issue. Example: Programme announced for rural employment strategy as part of five – year or report on children’s education etc.
Distinguish between Oral and Written Report:
| Oral Report | Written Report |
| No rigid standard format. | Standard format can be adopted. |
| Remembering all that is said is difficult. This is because the presenter cannot be interrupted frequently for clarification. | This can be read a number of times and clarification can be sought whenever the reader chooses. |
| Tone, voice modulation, comprehensibility play an important role. | Free from presentation problems. |
| Correcting mistakes if any is difficult. | Mistakes, if any can be pinpointed and corrected. |
| Audience has no control over the speed of presentation. | Not applicable. |
| Audience does not have the choice of picking & choosing from the presentation. | Reader can pick and choose what he thinks is relevant to him. |
PREPARATION OF RESEARCH REPORT:
Having decided on the type of report, the next step is report preparation. The following is the format of a research report:
1. Title Page
2. Page Contents
3. Executive Summary
4. Body
5. Conclusions and Recommendations
6. Bibliography
7. Appendix
- Title Page: Title Page should indicate the topic on which the report is prepared. It should include the name of the person or agency who has prepared the report. The date of the submission of the report is to be included in the report.
- Table of Contents: The table of contents will help the reader to know “what the report contains”. The table of contents should indicate the various parts or sections of the report. It should also indicate the chapter headings along with the page number.
| Chaper no. | Title of the Chapter | Page no. |
| 1 2 3 4 5 6 | Declaration Certificates Acknowledgement Executive summary Introduction to the project Research design and methodology Theoretical perspective of the study Company and industry profile Data analysis and interpretation. Summary of findings, suggestions and conclusions Bibliography Appendix | |
- Executive Summery: If your report is long and drawn out, the person to whom you have prepared the report may not have the time to read it in detail. Apart from this, an executive summary will help in highlighting major points. It is a condensed version of the whole report. It should be written in one or two pages. Since top executives summary should help in decision-making.
- An executive summary should have,
v Objectives
v Brief methodology
v Important findings
v Key results
v Conclusion
4. The Body: This Section includes:
v Introduction
v Methodology
v Limitations
v Analysis and interpretations
Introduction: The introduction must explain clearly the decision problem and research objective. The background information should be provided on the product and services provided by the organisation which is under study.
Methodology: How you have collected the data is the key in this section. For example, Was primary data collected or secondary date used? Was a questionnaire used? What was the sample size and sampling plan and method of analysis? Was the design exploratory or conclusive?
Limitations: Every report will have some shortcoming. The limitations may be of time, geographical area, the methodology adopted, correctness of the responses, etc.
Analysis and interpretations: Collected data will be tabulated. Statistical tools if any will be applied to make analysis and to take decisions.
5. Conclusion and Recommendation:
v What was the conclusion drawn from the study?
v Based on the study, what recommendation do you make?
6. Bibliography: If portions of your report are based on secondary date, use a bibliography section to list the publications or sources that you have consulted. The bibliography should include title of the book, name of the journal in case of article, volume number, page number, edition, etc.
7. Appendix: The purpose of an appendix is to provide a place for material which is not absolutely essential to the body of the report. The appendix will contain copies of data collection forms called questionnaires, details of the annual report of the company, details of graphs/charts, photographs, CDs, interviewers’ instructions. Following are the items to be placed in this section.
v Data collection forms
v Project related paper cuttings
v Pictures and diagrams related to project
v Any other relevant things.
How to write a Bibliography?
Bibliography, the last section of the report comes after appendices. Appendices contains questionnaires and other relevant material of the study. The bibliography contains the source of every reference used and any other relevant work that has been consulted. It imparts an authenticity regarding the source of the data to the reader.
Bibliography are of different types viz., bibliography of works cited this contains only the items referred in the text. A selected bibliography lists the item which the author thinks are of primary interest to the reader. An annotated bibliography gives brief description of each item. The method of representing bibliography is explained below.
Books
Name of the author, title of the book (underlined) publisher’s detail, year of publishing, page number.
v Single Volume Works. Dube, S.C. “India’s changing villages”, Routledge and Kegan Paul Ltd.,1958, p.76.
Chapter in an Edited Book
v Warwick, Donald P., “Comparative Research Methods” in Balmer, Martin and Donald Warwick (eds), 1983, pp.315-30.
Periodicals Journal
v Dawan Radile (2005), “They Survived Business World”(India), May 98, pp.29-36.
Newspaper, Articles
v Kumar Naresh, “Exploring Divestment”, The Economic Times(Bangalore), August 7,1999, p.14.
Website
v www.infocom.in.com
For citing Seminar Paper
v Krishna Murthy, p., “Towards Excellence in Management” (Paper presented at a Seminar in XYZ College Bangalore, July 2000).
How To Write A Research Proposal?
Research Proposal is a document. Through this document, the decision maker and researcher enter into a contract. This document prepared by the researcher, explains the activities to be undertaken, to get the needed information. It also informs the decision maker, the time taken to complete the investigation and also the cost to be incurred.
Contents of Research Proposal
Following are the contents of research proposal:
- Purpose of proposed research:
(a) Goals and objectives to be stated.
(b) Scope of the study (what will be included and what will not be included).
(c) Limitations if any due to time and money constraints, etc.
(d) What questions will the investigation answer?
- Type of study:
(a) Is the study exploratory, descriptive or casual?
(b) Explain how secondary data will be used?
(c) Describe the method of gathering primary data.
- Target population/ group to be defined: From whom is the data collected.
- Sample Size: Sample size is to be determined. At research proposal stage, this will be approximate, since the response rate and accuracy required cannot be predicted. If accuracy required is more, one has to choose bigger sample size and vice versa. This would mean more cost and time.
- Sample Design: Is the sample probabilistic or non- probabilistic? If probabilistic, what kind of sample? Is it random sampling or systematic random sampling?, etc.
- Data Collection: Will questionnaire be used? If yes, is it structured or unstructured, disguised or undisguised. Is the study descriptive or casual or exploratory? Will the questionnaire be filled in presence of researcher or to be filled by respondent at their home without the presence of interviewer? If the data collection is by mail questionnaire, what incentive is being given in order to ensure response. Data collection may include qualitative phase and could involve focus group, depth interview, etc.
- Research instrument: Questionnaire or any other tool used to collect data and suitable scales used as tools to analyze the data.
- Benefit: Description/ Explanation of cost-benefit analysis. How the value of information is going to help the decision makers.
- Estimation of the cost of the project: Total cost of the project (proposal budget and likely payoff. Also how long will it take to complete the project.
- Profile of the research firm: Background of the firm, overview and skill of the researcher such as qualification, experience, etc.
- Presentation: Presentation should include the methodology used by any research firm and all the above contents. It should be designed in such way, to answer all the possible doubts of the clients about the research. Researcher should also convince the client about the validity and reliability of the research to be undertaken and its methodology.
Ethical Angle of the Research Proposal
Can the research supplier guarantee that all discussions, materials and findings will be held in confidence? This is especially critical in cases of new product feasibility studies, particularly in the industrial sector with long product development/ introduction cycles.
Style and Layout of the Report:
Style of report writing:
Remember that the reader:
· Has short of time,
· Has many other urgent matters demanding his or her interest and attention,
· Is probably not knowledgeable concerning ‘research jargon’.
Therefore the rules are:
· Simplify. Keep to essentials
· Justify. Make no statement that is not based on facts and data.
· Quantify when you have the data to do so. Avoid large, small, instead, say 50%, 1 in 3.
· Be precise and specific in your phrasing of findings.
· Inform, not impress. Avoid exaggeration.
· Use short sentences.
· Use adverbs and adjectives sparingly.
· Be consistent in the use of tenses (past or present tense). Avoid the passive voice, if possible, as it creates vagueness (e.g.: ‘patients were interviewed’ leaves in uncertainty as to who interviewed them) and repeated use makes dull reading.
· Aim to be logical and systematic in your presentation.
Layout of the report:
A good physical layout is important, as it will help your report.
· Make a good initial impression
· Encourage the readers, and
· Give them an idea of how the material has been organized so the reader can make a quick determination of what he will read first.
Particular attention should be paid to make sure there is:
· An attractive layout for the title page and a clear table of contents.
· Consistency in margins and spacing.
· Consistency in headings and subheadings, for example, font size 16 or 18 bold, for heading of chapter: size 14 bold for headings of major sections: size 12 bold, for headings of subsections, etc.
· Good quality printing and photocopying. Correct drafts carefully with spell check as well as critical reading for clarity by other team members, your facilitator and, if possible, outsiders.
· Numbering of figures and tables, provisions of clear titles for tables, and clear headings for column and rows, etc.
· Accuracy and consistency in quotations and references
PRECAUTIONS IN REPORT WRITING:
Endless description without interpretation is another pitfall. Table need conclusion not detailed presentation of all numbers or percentages in the cell which reader can see for themselves. Neglect of qualitative data is also quite common. Still quotes of informants as illustration of your findings and conclusion make your report lively. They also have scientific value in allowing the reader to draw his or her own conclusion from the data you present. Sometimes qualitative data are just coded and counted like quantitative data without interpretation where as they may be providing interesting illustrations of reasons for the behavior of informants or of their attitudes.
· The inclusion of careless, inaccurate or conflicting data.
· The inclusion of outdated or irrelevant data.
· Facts and opinions that are not separated.
· Unsupported conclusions and recommendations
· Careless presentation and proofreading.
· Too much emphasis on appearance and not enough on content.
The merits and demerits of oral report:
Merits
· The reporter can use voice modulation emphasis.
· Repetition is possible in case there is need.
· More clear consumption of research results.
· It is very effective when the report is meant for specialists.
Demerits
- It has no visual effect.
- The place of presentation cannot be controlled.
- The oral report is not subject to detailed scrutiny.
- The established standards for oral presentation are not stringent.
The merits and demerits of written report:
Merits
· They results are presented in prompt way under visual aids that helps the hearers or seekers to understand fast.
· The attendees can ask any question at given point of time.
· It has documentary proof.
· Report writer works hard in case of written report as they command good attention and scrutiny.
Demerits:
· It gets limited attention span from audience as they are busy reading.
· The attendee’s attention is not fully controlled.
· The reporter trend to hurry up the report to finish his work of presentation.
Distinction Between Report And Essay Writing:
| A Report | An Essay |
| Presents information | Presents an argument |
| Is meant to be scanned quickly by the reader | Is meant to be read carefully |
| Uses numbered headings and sub-headings | Uses minimal sub-heading, if any |
| May not need references and bibliography/reference list | Always needs references and bibliography / reference list |
| Use short , concise paragraphs and dot-points where applicable | Links ideas into cohesive paragraph, rather than breaking them down into a list of dot-points |
| Uses graphics wherever possible (tables, graphs , illustrations) | Rarely uses graphics |
| May need an abstract (sometimes called an executive summary) | Will only need an abstract if it is very long ,or if your lecturer asks for one specifically |
| May be followed by recommendations and / or appendices | Seldom has recommendations or appendices |
GRAPHICAL REPRESENTATION OF REPORT
There are several ways of making presentation of statistics in the research report and four of them are most important. They are
- Textual explanation: Textual presentations are used when there are only a few statistics. The drawback is that the reader has to read the entire text before finding or locating the meaning.
- Semi tabular form: This method is used when there are just a few figures. Whenever there is a comparison, this method is used.
- Tabular form: These are superior to text for presenting statistics. Tables enable quantitative comparison and provide a precise way to present the data.
- Graphics: Graphics presentation is the only way to present quantitative data effectively. There are 2 basic kinds of graphics namely charts which show ‘how much’ & diagrams that show ‘how’. Charts are generally the most useful for research reports & diagram the least useful.
The various charts used in report writing are given below:
1) Line Chart 2) Bar Chart 3) Pie Chart
4) Stratum Chart 5) Scatter diagram 6) Pictogram
1) LINE CHART:
Line chart shows information over a period of time.
A line chart is a two dimensional chart, when more than one variable is presented, it is preferable to use 2 different colors for one each type of line chart. The greatest disadvantage of line chart is that the number of items that can be compared on one line chart is limited.
In the chart below time change is shown from left to right (X axis) and change in units produced on the y axis.

The following figure is a line chart that shows a range of data for a particular time. This is called hi-low chart or variance chart. This type of line chart is extensively used to analyze stock market indices or to analyze high/low of a stock during intraday trading.

2) BAR CHART:
This is a very popular form of graphical representation, because it is very easy to interpret. They show magnitude of comparison between groups.
Vertical or horizontal bars are used to represent frequencies & percentage numbers. In bar chart, the length of the bars represents the quantities that they stand for.
 Transport used to commute to the place of work in a metro.

If two or more quantities are to be represented in a single chart, Clustered bar chart is used. In this type of chart, bars show the values of the quantities compared. Cross hatching or different colors may be used to distinguish different kinds of information.

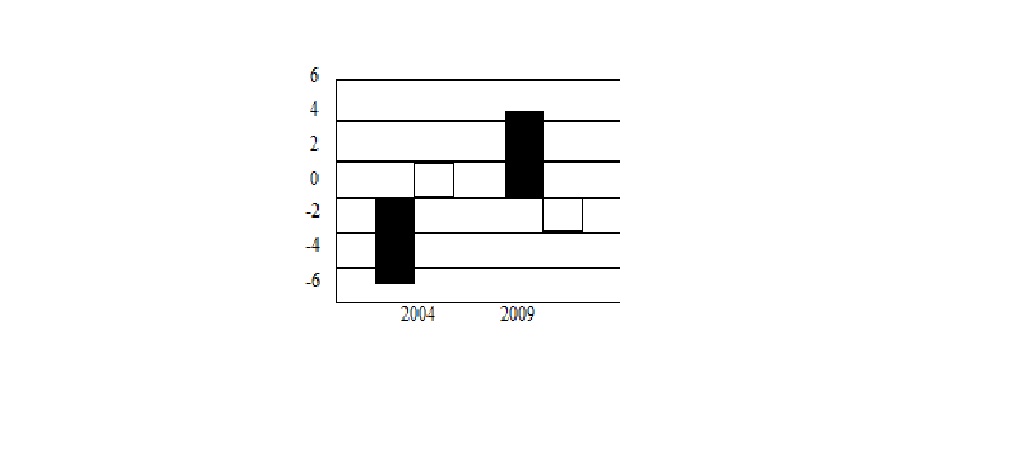
When the researcher wants to show plus and minus differences, bilateral column charts are used.
Titles of the bar will appear either up or down. Bilateral column charts are good for showing percentage change.
Bilateral column chart showing vote swing in general election.
Sometimes subdivisions of the column need to be compared. In this case stacked column chart is used.

3) PIE CHART:
In pie chart a circle is divided into sections. Each section represents a portion of the total. The advantage of pie chart is that the area represented is proportional to the size of the item. Pie chart is excellent for showing the decomposition of a total quantity into its components. The disadvantage of pie chart is that the number of items that can be incorporated is limited. Constructing a pie chart may not be helpful, when the total is made up of numerous components, each of them contributing & equally to the total.
The pie chart below shows the sales of a company during different months

4) STRATUM CHART:
It is a two dimensional graph with time along the horizontal axis & values of the item plotted on the vertical axis. The area of the graph is divided into several horizontal layers, or strata, one layer corresponding to each item. The width of each stratum represents the relative magnitude of the corresponding item at that time.
In the fig below lowest stratum represents Brand A. The second lowest stratum corresponds to brand B. The line representing the upper boundary of this stratum represents the sum of the market shares of Brand A & Brand B.
Therefore we can say that stratum chart is a cumulative line chart. Changes in relative magnitude over a period of time are tracked.

5) SCATTER DIAGRAM:
This diagram shows whether any relationship exists between the two variables under consideration. In a scatter diagram if the points are closer to the straight line to be drawn, we can conclude that there is a strong relationship between the variables. Scatter diagram gives 2 type of information. Visually, we can find out if the 2 variables are related. Secondly, if it is related what kind of line describes the relationship is it linear or curvilinear, etc.

6) PICTOGRAM:
This is a special type of bar chart. It uses pictures instead of rectangular bars. A pictograph is an ideogram that conveys its meaning through its pictorial resemblance to a physical object. The advantage of a pictogram is that, it is more appealing & interesting to the reader. Pictographs can often transcend languages in that they can communicate to speakers of a number of tongues & language families equally effectively, even if the languages and cultures are completely different. This is why road signs and similar pictographic material are often applied as global standards expected to be understood by nearly all.


2 comments:
Dude...u r a manager already. What a thoughtful thing u've done. Awesome. Gr8 Job re...
Fantastic man......
Post a Comment